
Fallstudie – Transport
Über 3'000 sicherheitskritische U-Bahn-Türen, live aus der Cloud überwacht mit dem Gilgen Live Monitoring System
Überblick
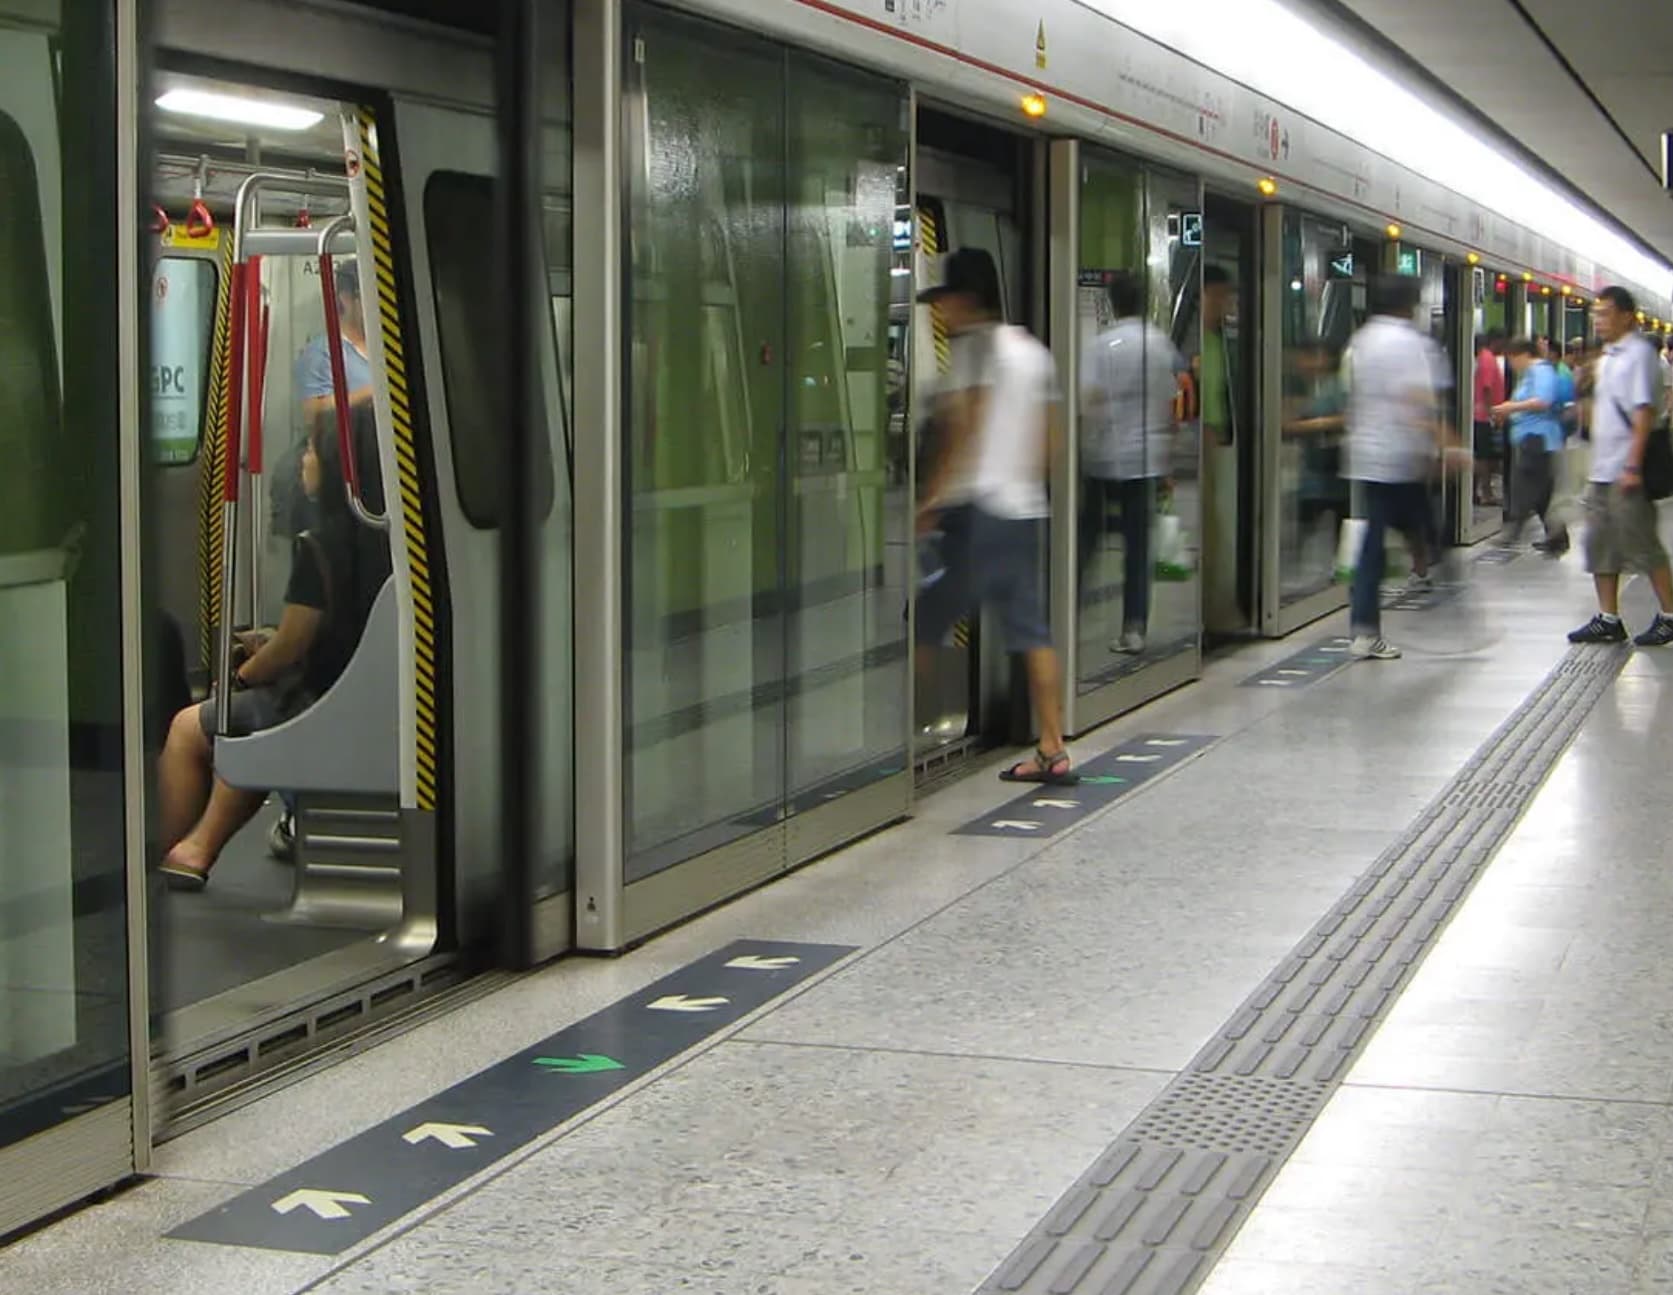
Gilgen Door Systems (GDS) ist ein Schweizer Hersteller von Hochleistungs-Automatiktüren mit einem starken Schwerpunkt auf Bahnsteigtüren (Platform Screen Doors, PSD) für U-Bahn-Stationen und Bahnnetze in Europa und im asiatisch-pazifischen Raum. Bahnsteigtüren sind sicherheitskritische Systeme – sie laufen rund um die Uhr im Dauerbetrieb – und eine einzige defekte Türeinheit kann den Zugverkehr stören.
Bis zu diesem Projekt umfasste das Wartungskonzept von GDS vorbeugende Wartung in festen Intervallen und reaktive Wartung nach einem tatsächlichen Ausfall. Die Servicetechniker erhielten zwar Alarmmeldungen, hatten aber keinen Einblick in den Zustand der Türen aus der Ferne: Eine Störung zu diagnostizieren hiess, zur Station zu fahren, sich physisch an die SPS anzuschliessen, Logdateien herunterzuladen und rohe Fehlercodes zu deuten. Bei Dutzenden Türen pro Station und Anlagen über mehrere U-Bahn-Netze verteilt ist dieses Vorgehen personalintensiv und lässt keine Vorhersage von Ausfällen zu.
56k.Cloud hat gemeinsam mit GDS ein Cloud-natives Live Monitoring System (LMS) entworfen und umgesetzt: eine eigens gebaute IoT-Plattform, die die Lücke zwischen den physischen Türsteuerungen und einem zentralen Echtzeit-Dashboard für den Betrieb schliesst. Das System verbindet jede PSD-Steuerung im Netz über ein industrielles Edge-Gateway mit der Cloud. So können GDS und die U-Bahn-Betreiber Türereignisse von überall auf der Welt überwachen, diagnostizieren und darauf reagieren, ohne den Bahnsteig zu betreten.
Ausgangslage
Gilgen Door Systems stand vor mehreren eng miteinander verzahnten Herausforderungen im Betrieb und in der Technik:
- Keine Sicht auf Störungen aus der FerneDie Türsteuerungen (SPS) und die zugehörigen Feldbusnetze liefen in abgeschotteten Stationsumgebungen, vollständig getrennt von jeder Cloud- oder Internetinfrastruktur. Weder GDS noch der U-Bahn-Betreiber hatten eine Möglichkeit, den Türstatus in Echtzeit zu sehen.
- Manuelle, zeitraubende DiagnoseWurde ein Störalarm ausgelöst, blieb nur, einen Techniker vor Ort zu schicken. Das Abholen der Fehlerprotokolle erforderte eine physische FTP-Verbindung zur SPS – ein Vorgang, der Stunden dauern konnte, besonders bei Stationen in weiträumig verteilten U-Bahn-Netzen.
- Verstreute Daten, kein Blick auf den GesamtbestandJede Station war eine Insel. Es gab keine zusammengeführte Sicht auf den Türenbestand, und damit keine Möglichkeit, systematische Muster zu erkennen, den Zustand verschiedener Stationen zu vergleichen oder Wartungsressourcen nach dem tatsächlichen Risiko zu priorisieren.
- Grenzen bei der SkalierungDie Anlagen von GDS wuchsen über mehrere Betreiber und Regionen hinweg. Ein Wartungsmodell, das für jede Diagnose einen Einsatz vor Ort verlangt, kann mit diesem Wachstum nicht Schritt halten.
- Druck durch Regulierung und AuditsU-Bahn-Betreiber verlangen zunehmend detaillierte Audit Trails und Verfügbarkeitsberichte für sicherheitskritische Systeme. Das manuelle Einsammeln von Logdateien reichte für diese wachsenden Compliance-Pflichten nicht aus.
Um diese Punkte anzugehen, suchte GDS eine cloudbasierte IoT-Plattform mit Edge-Computing-Fähigkeiten: eine Plattform, die sich an die bestehende Feldinfrastruktur anbinden lässt, ohne sie zu ersetzen, und die die Grundlage für eine datengetriebene, vorausschauende Wartungsstrategie bildet.
Lösung
56k.Cloud hat eine durchgängige IoT-Lösung entworfen und geliefert – von der Auswahl der Hardware über die Software an der Edge und die Cloud-Infrastruktur bis zum webbasierten Dashboard für den Betrieb. Die Architektur folgt drei Leitprinzipien:
- Nicht-invasive Integration (keine Änderung an bestehender Feldhardware oder SPS-Software)
- Sicherheit von Anfang an (in Hardware verankerte Geräteidentität und Cloud-Zugriff nur so weit wie nötig)
- SaaS-Wiederholbarkeit (die Plattform lässt sich für neue Betreiber aufschalten, ohne den Kern neu zu bauen)
Edge-Ebene (industrielles IoT-Gateway)
In jedem Technikraum einer U-Bahn-Station steht ein industrietaugliches IoT-Edge-Gateway. Das Gerät verbindet zwei Welten: Auf der einen Seite hängt es am lokalen OT-Netz der Station, spricht über OPC UA – das übliche industrielle Protokoll für Interoperabilität – mit den Tür-SPS und empfängt strukturierte Fehlerprotokolle und Bewegungsprofildateien per FTP. Auf der anderen Seite hält es eine gesicherte, authentifizierte Verbindung in die Cloud über 4G LTE, wobei ein in Hardware hinterlegtes Gerätezertifikat jedem Gateway eine eindeutige, manipulationssichere Identität gibt.
Auf dem Gateway laufen eine industrielle IoT-Middleware (für die Feldbuskommunikation) und eine aus der Cloud verwaltete Laufzeitumgebung für Edge-Computing, abgesichert durch die genannten Cybersecurity-Funktionen. Drei eigens entwickelte Softwarekomponenten laufen dauerhaft auf dem Gerät:
- Heartbeat- und TelemetriekomponenteFragt in regelmässigen Abständen Betriebsdaten der Türen von den SPS ab (Türzustand, Verriegelungszeit, Motorparameter, Zykluszähler) und sendet sie über ein schlankes Nachrichtenprotokoll in Echtzeit in die Cloud.
- Fehlerprotokoll-KomponenteErkennt strukturierte Fehlerereignis-Logdateien der SPS nach Zeitplan, holt sie ab und lädt sie in den Cloud-Objektspeicher, mit lokaler Zwischenspeicherung für bis zu 48 Stunden Verbindungsausfall ohne Datenverlust.
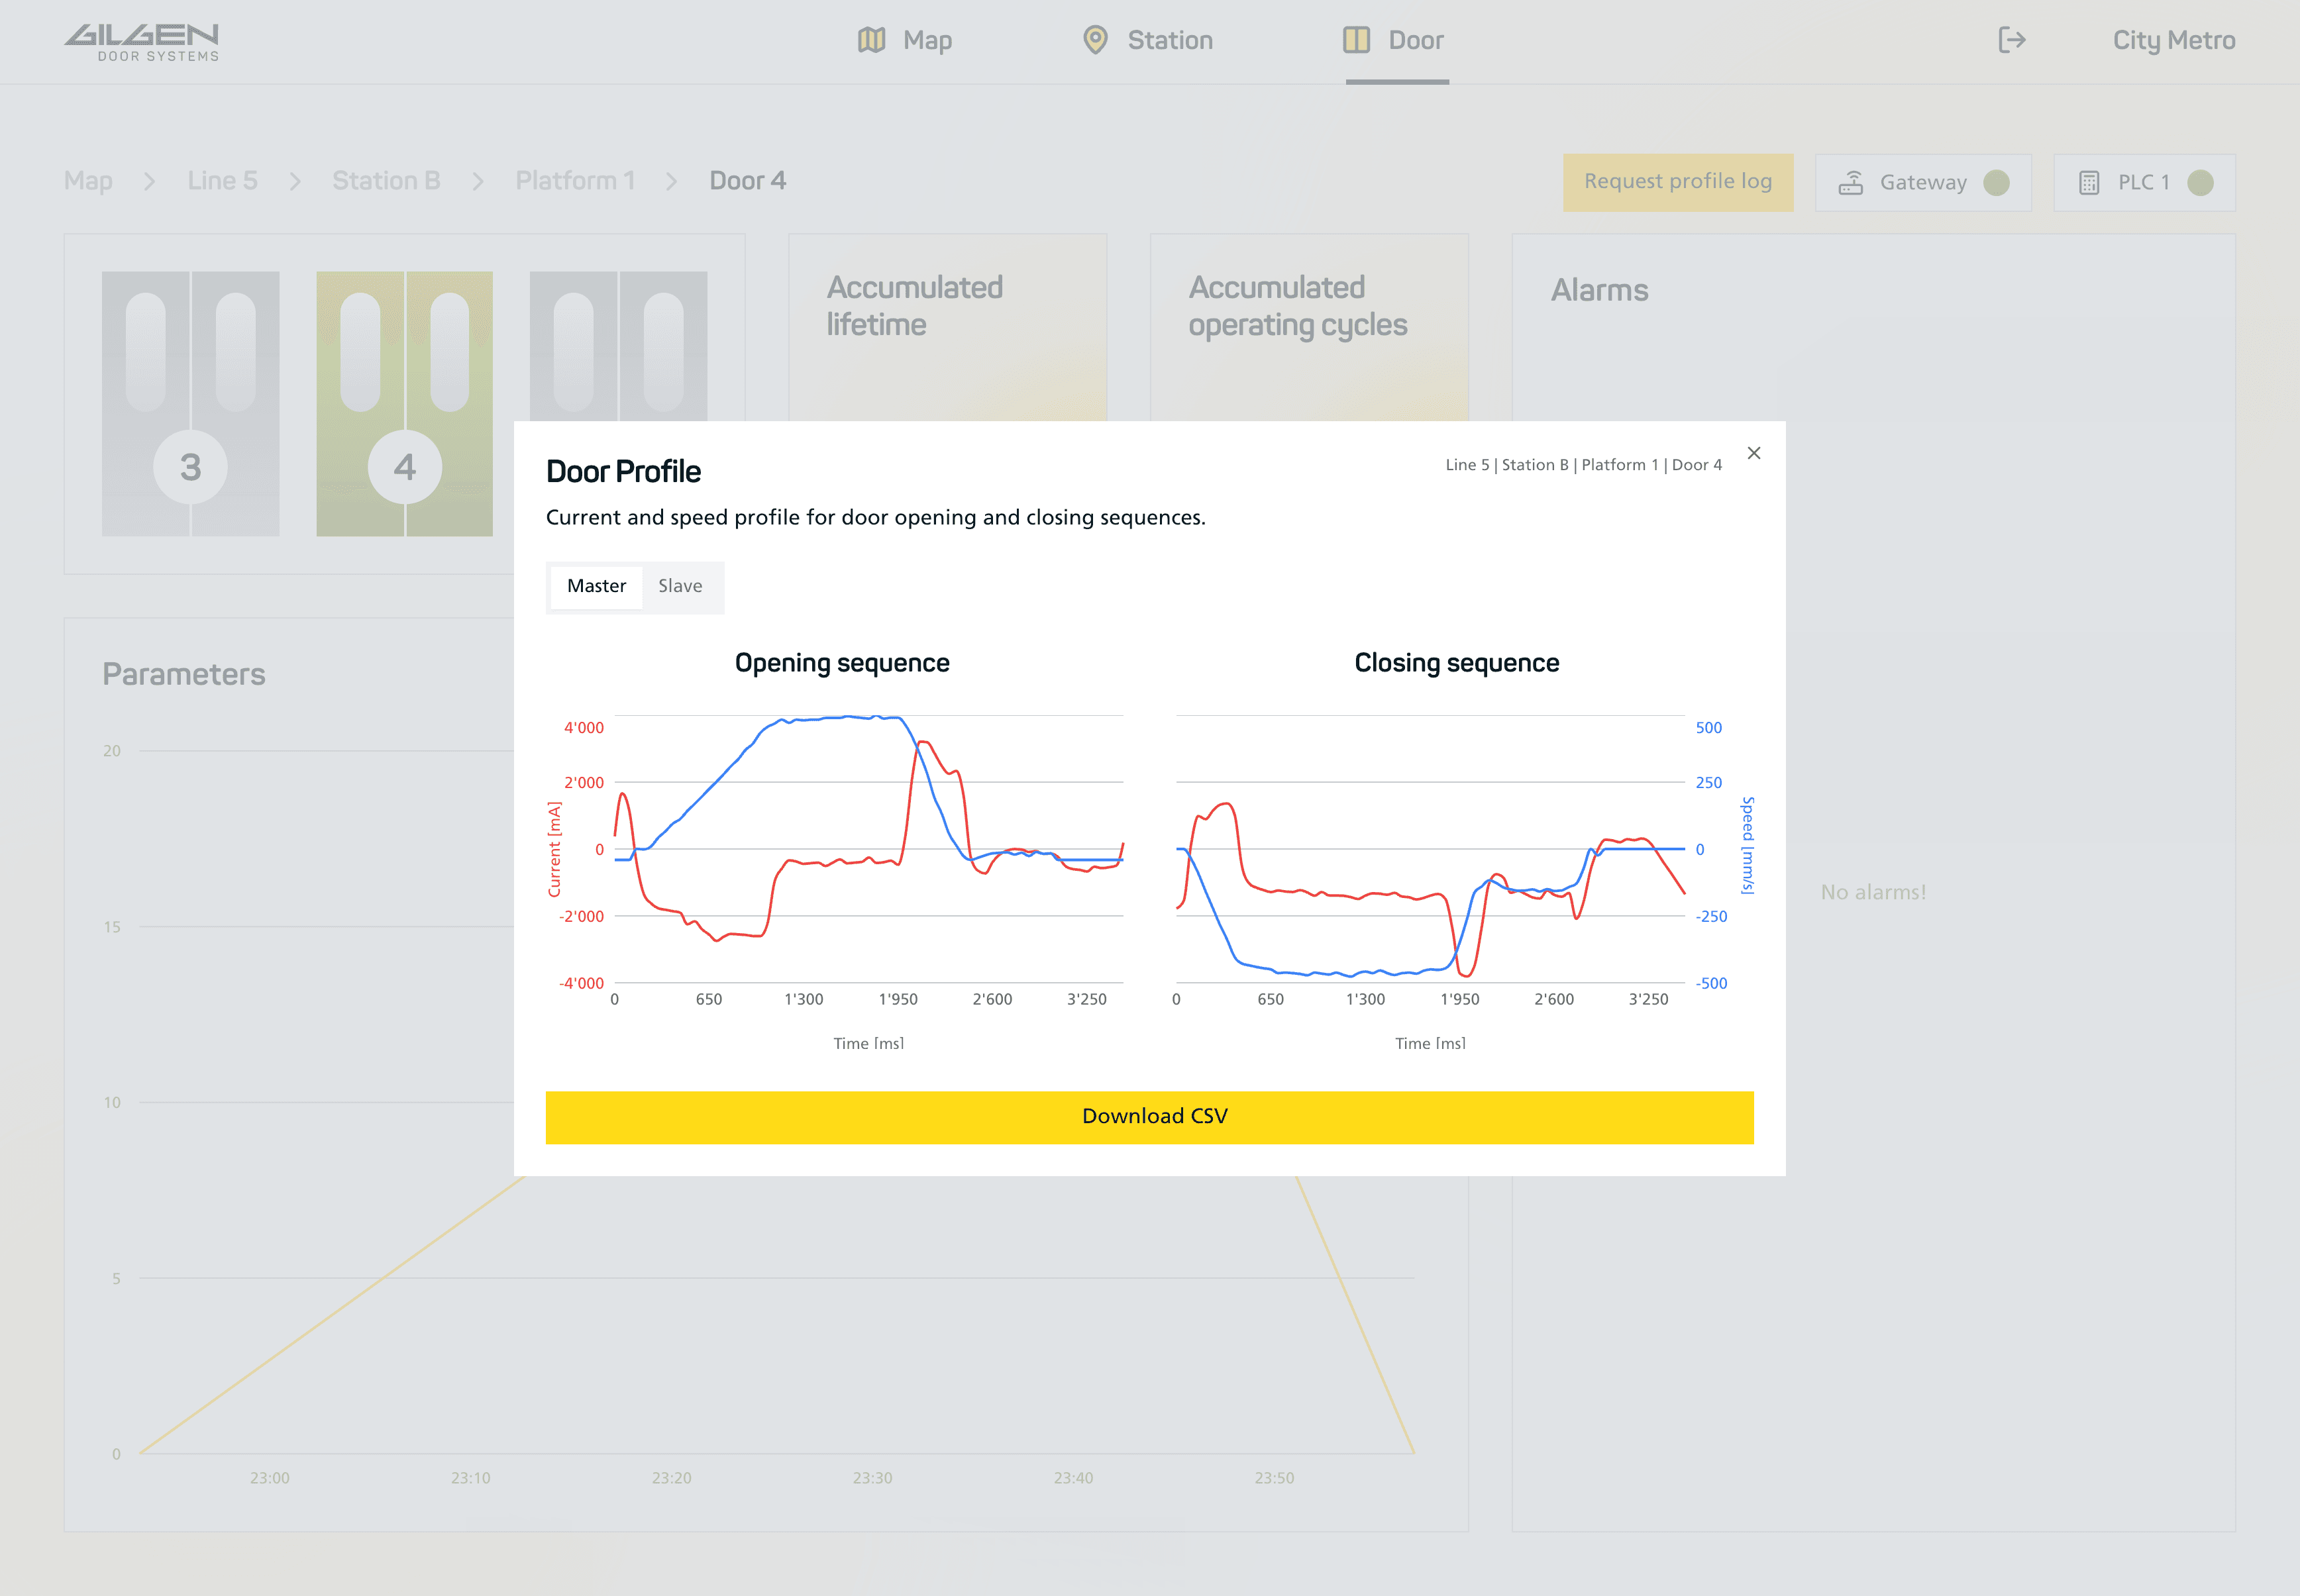
- Profilprotokoll-KomponenteRuft vollständige Bewegungsprofile der Türen ab (die Motorstromkurve jedes Türzyklus) und legt sie in der Cloud ab, für Trendanalysen und die frühe Erkennung von Auffälligkeiten.
Alle Softwarekomponenten an der Edge werden aus der Cloud als Over-the-Air-Updates ausgeliefert und aktualisiert – für die Softwarepflege ist damit kein Einsatz vor Ort nötig.
Cloud-Ebene
Das Cloud-Backend basiert auf einer zentral kontrollierten Cloud-Infrastruktur mit mehreren Accounts und getrennten Umgebungen für Entwicklung, Staging und Produktion. Ein Landing-Zone-Rahmen setzt Sicherheitsstandards, zentrale Audit-Protokollierung und Zugriffsregeln über Accountgrenzen hinweg in allen Umgebungen durch.
Die eingehende Telemetrie der Gateways nimmt ein Cloud-Dienst für IoT-Konnektivität entgegen, der jedes Gerät authentifiziert und die Nachrichten über eine Regel-Engine weiterleitet. Von dort fliessen die Daten in verschiedene Verarbeitungswege:
- Industrieller Zeitreihenspeicher
- Cloud-Objektspeicher
- Verwaltete NoSQL-Datenbank
- Serverless-Funktionen
Anwendungsebene
Die Oberfläche für die Betreiber ist eine Webanwendung, die den gesamten Türenbestand auf mehreren Ebenen zeigt.
- NetzkarteGeografische oder schematische Übersicht aller Stationen; farbcodierter Zustand; Anzahl der Alarme je Station.
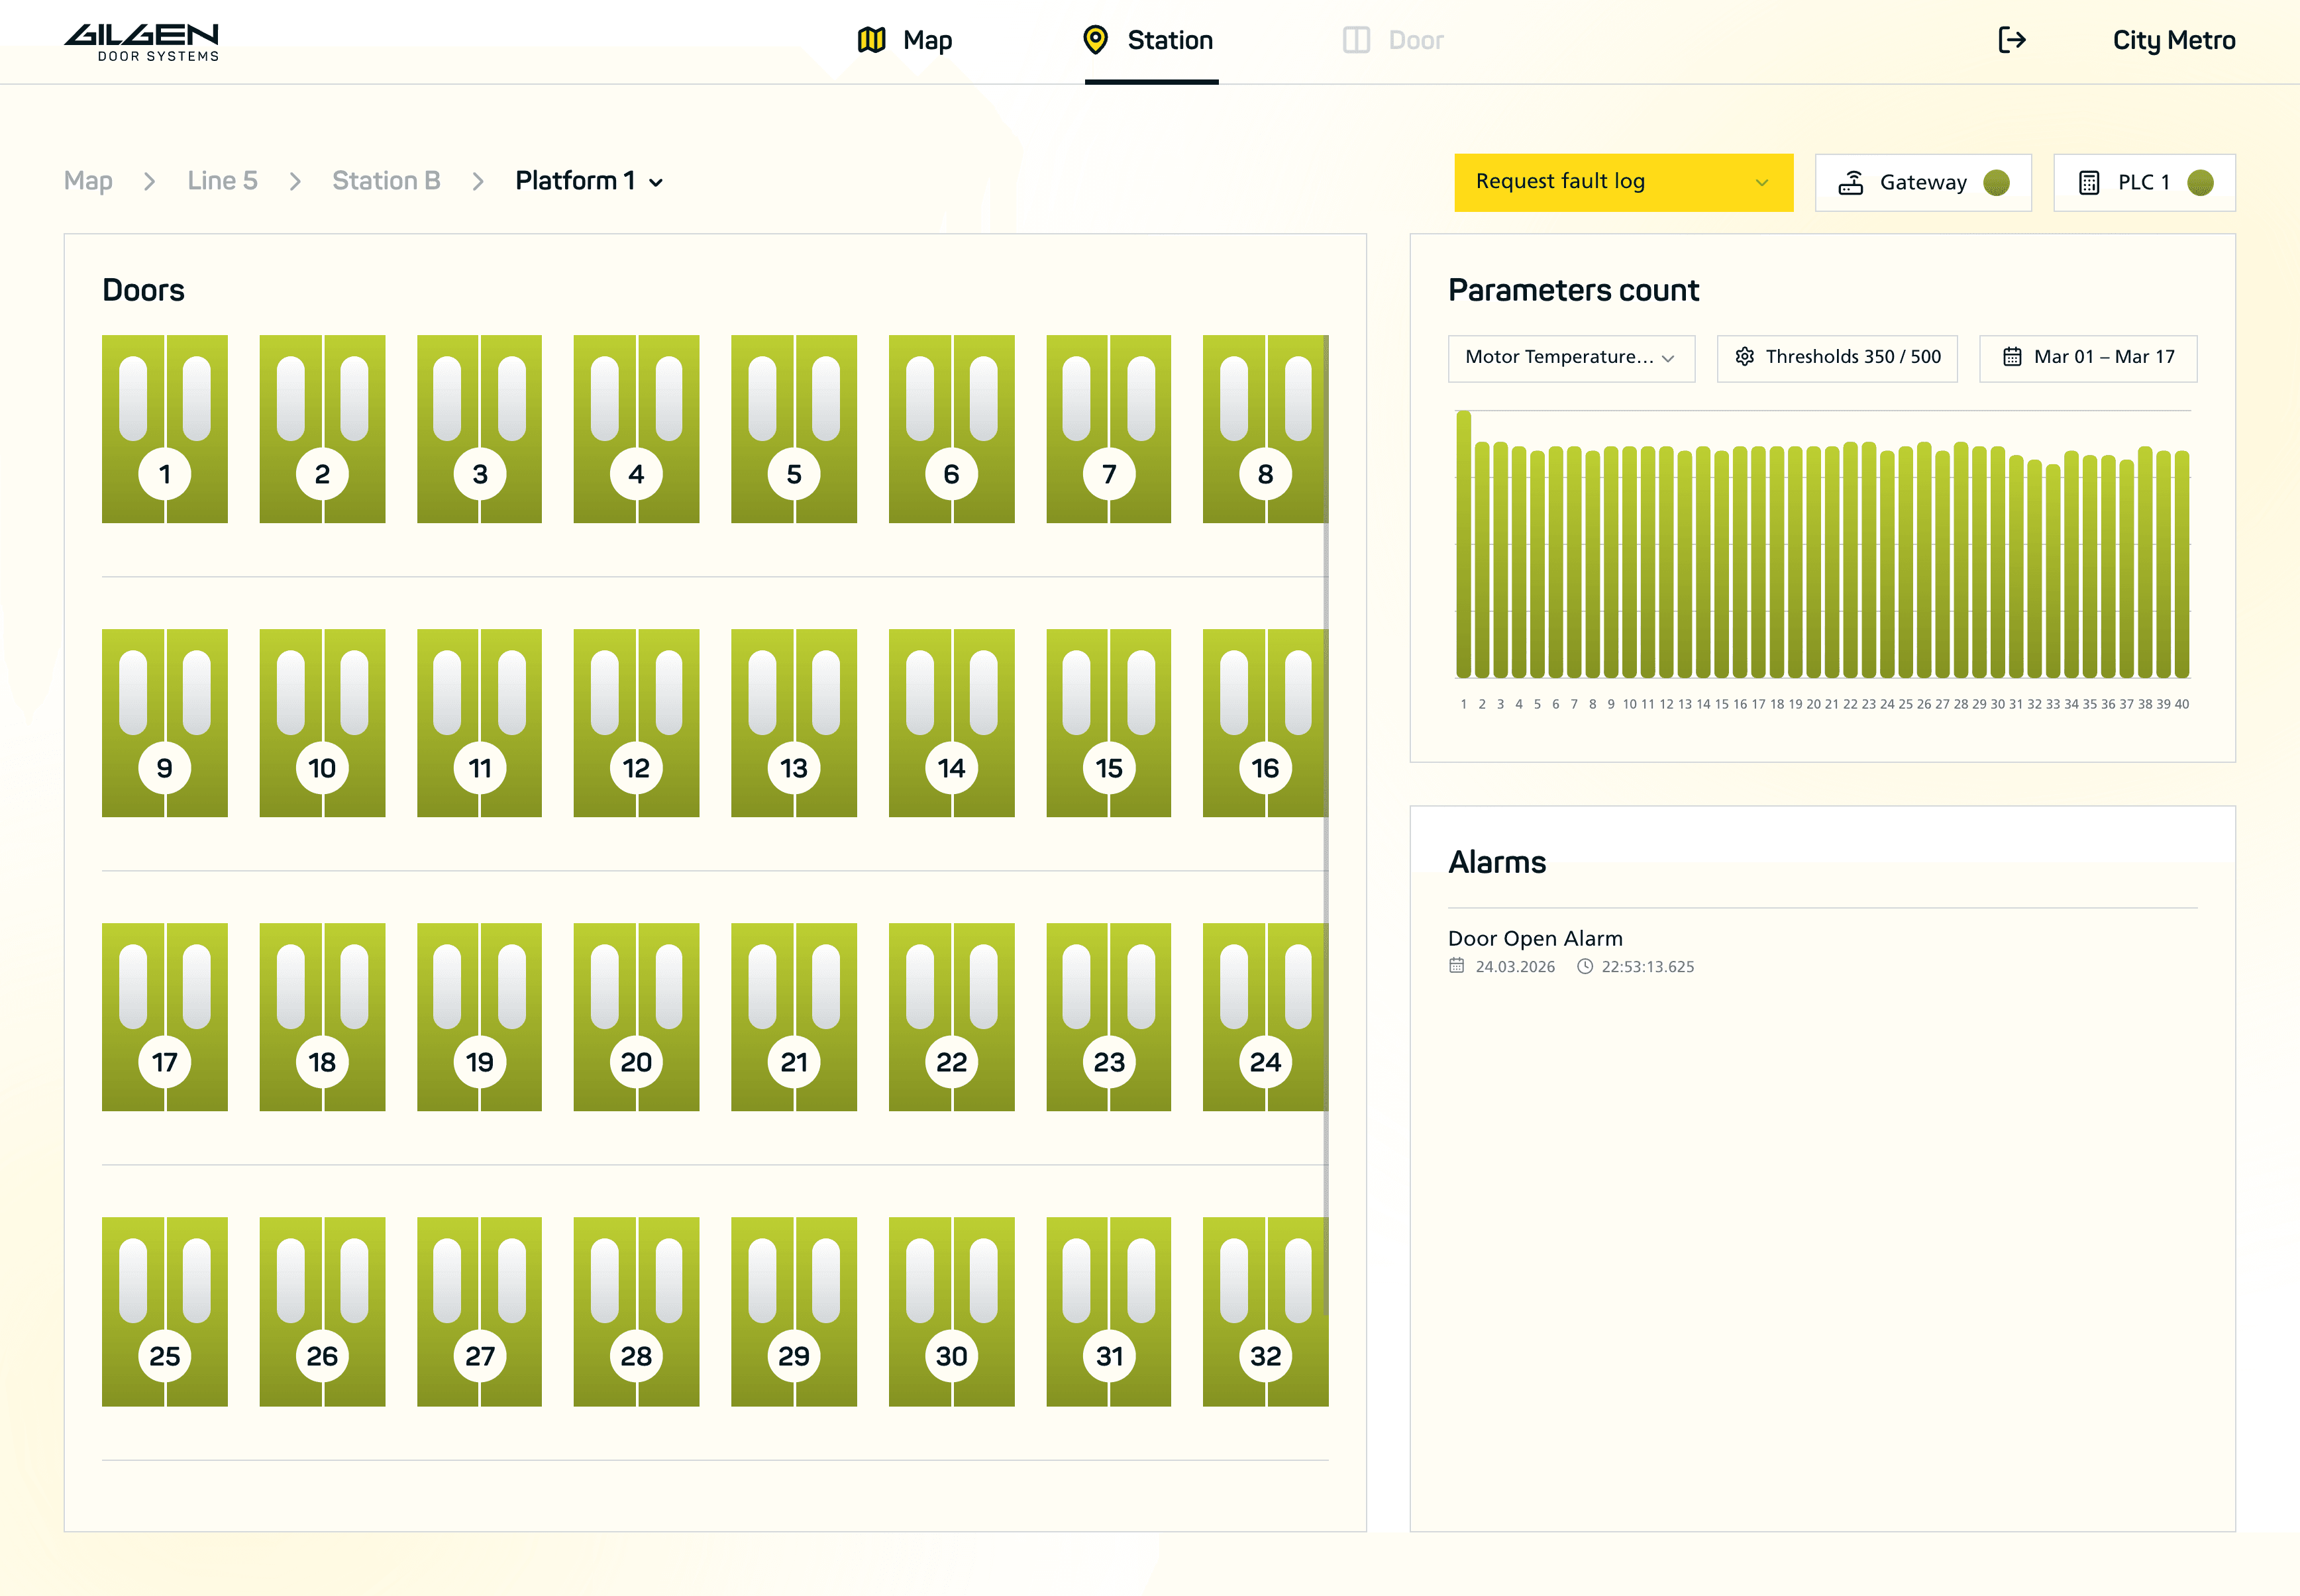
- StationsansichtVerbindungsstatus von Gateway und SPS je Station; Auswahl des Bahnsteigs; Liste der aktuellen Alarme.
- TürrasterGrafische Übersicht aller Türen eines Bahnsteigs (bis über 40 je Station); Status jeder Tür mit Störungsanzeige.
- AlarmeEchtzeit-Alarmstrom: Hinderniserkennung, Störungen in der Stromversorgung, Ausfall mehrerer Türen, klassifiziert nach Schweregrad.
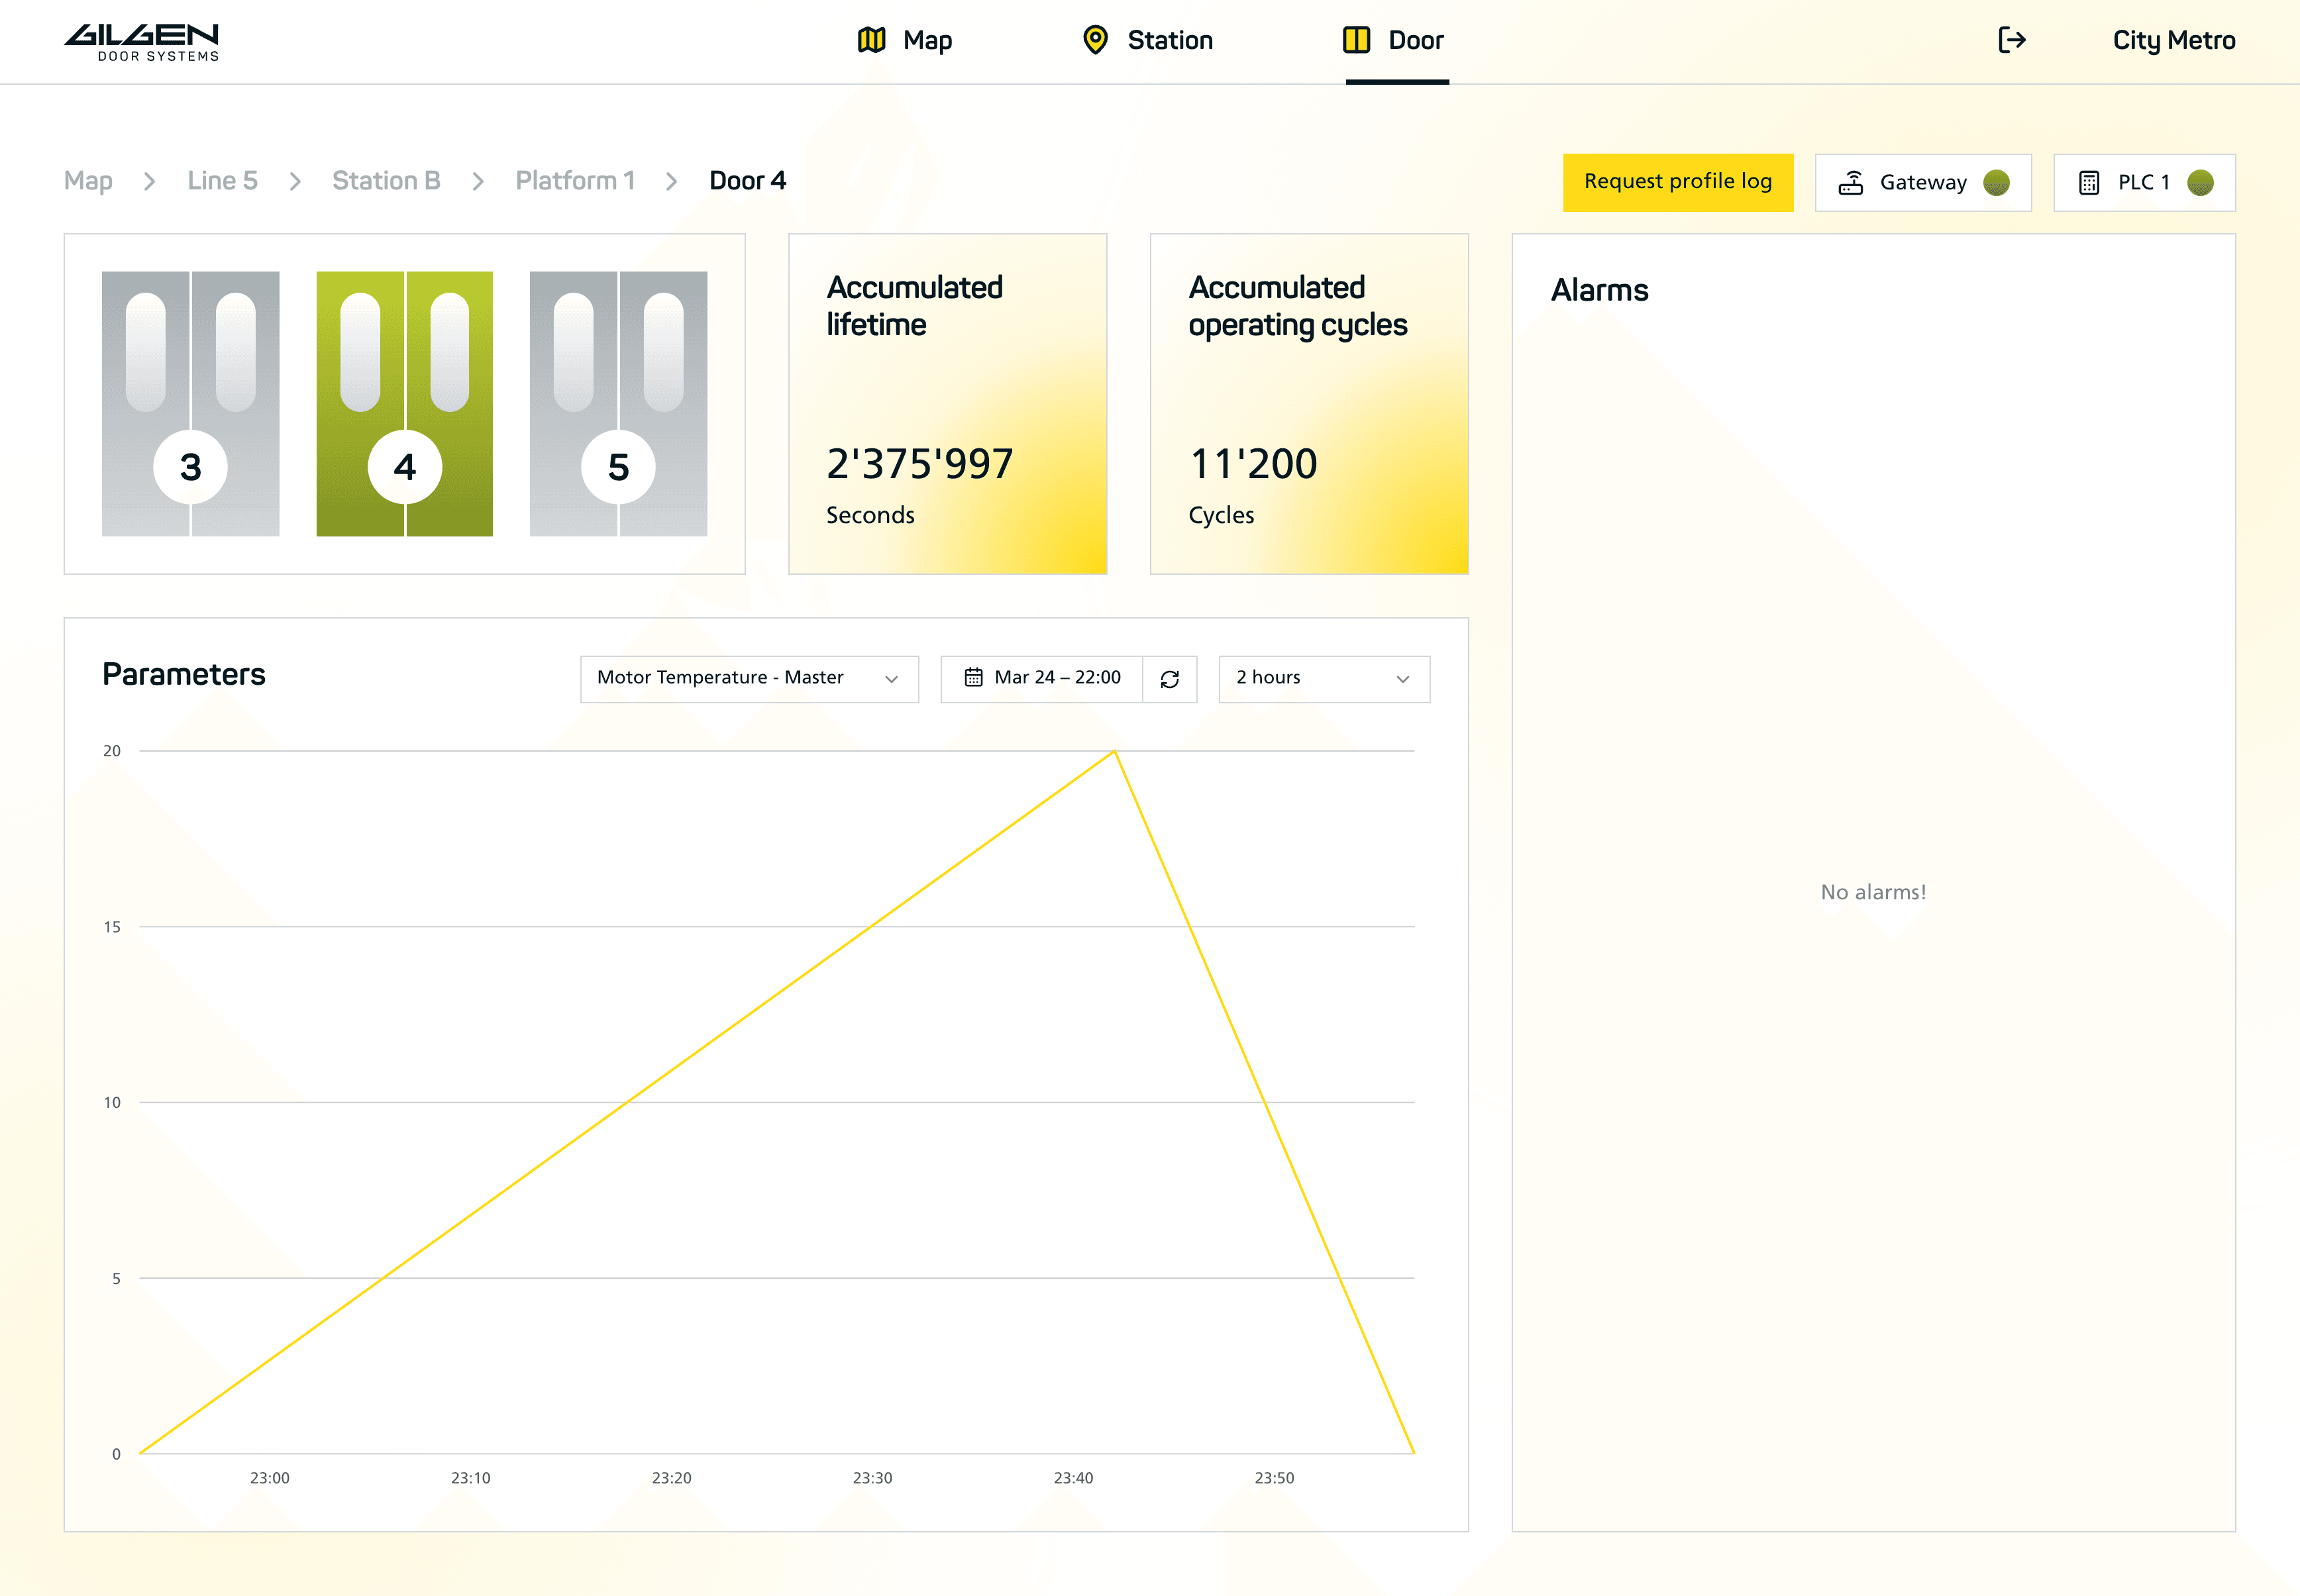
- ParameteranalyseZeitreihendiagramme für mechanische Parameter; konfigurierbare Warn- und Grenzwerte als Überlagerung; historischer Vergleich über Türen und Zeiträume hinweg.
Das Dashboard wird als in der Cloud gehostete Webanwendung bereitgestellt und ist für berechtigte Nutzer von jedem Gerät aus erreichbar, mit rollenbasierter Zugriffssteuerung und per JWT abgesicherten API-Aufrufen. Ergebnisse der Echtzeit-Analyse werden über eine dauerhafte WebSocket-Verbindung in den Browser geschoben, sodass kein wiederholtes Abfragen nötig ist.
Ergebnis
Die Einführung des LMS über den ersten Bestand hinweg (16 Stationen und über 640 einzelne Türgeräte) hat messbare Ergebnisse im Betrieb und im Geschäft gebracht:
Ergebnisse im Betrieb
- Durchgehende Fernüberwachung jeder angebundenen Tür, rund um die Uhr, über alle Stationen gleichzeitig aus einem einzigen Dashboard, ohne jede Präsenz vor Ort.
- Störungsmeldung in weniger als einer Minute: Löst eine Tür einen Alarm aus, erscheint das Ereignis binnen Sekunden im Dashboard und geht an das zuständige Wartungsteam – statt Stunden später bei einer manuellen Kontrolle entdeckt zu werden.
- Ferndiagnose: Fehlerprotokolle und Betriebsdaten stehen sofort im Dashboard bereit. Die Techniker erkennen die Ursache und kommen mit dem richtigen Ersatzteil und Werkzeug an, statt zuerst auf Erkundung zu fahren.
- Frühe Erkennung von Auffälligkeiten: Die Entwicklung mechanischer Türparameter (Motorstromprofile, Verriegelungszeiten, Zykluszahlen) zeigt, welche Türen nachlassen, bevor sie ausfallen – so wird ein geplanter Eingriff möglich statt eines Noteinsatzes.
Ergebnisse im Geschäft
- Weniger Einsätze vor Ort: Weil sich Alarme aus der Ferne einordnen und diagnostizieren lassen, entfällt ein erheblicher Teil der alarmbedingten Fahrten oder lässt sich in geplante Wartungsfenster bündeln.
- Höhere Anlagenverfügbarkeit: Schnellere Reaktion auf Störungen und vorausschauend geplante Wartung senken die Ausfallzeit der Türen unmittelbar und machen den Betrieb für den U-Bahn-Betreiber zuverlässiger.
- Compliance und Nachvollziehbarkeit: Alle Türereignisse, Fehlerprotokolle und Parameterverläufe werden gespeichert und sind abfragbar – der detaillierte Audit Trail, den U-Bahn-Betreiber und Sicherheitsbehörden verlangen.
- Skalierbarer Betrieb: Dasselbe Technikteam betreut heute einen deutlich grösseren Türenbestand, ohne dass der Personalbedarf im gleichen Mass steigt. Jeder Techniker deckt mehr Türen ab.
- SaaS-Wiederholbarkeit: Die Plattformarchitektur ist darauf ausgelegt, weitere U-Bahn-Betreiber und Regionen aufzuschalten, ohne sie grundlegend neu zu bauen. Jede neue Betreiberumgebung erbt dieselben Sicherheitsstandards, Überwachungsfunktionen und Betriebswerkzeuge.
Kennzahlen
- 16 überwachte Stationen
- Über 3'000 betreute Türen
- 16 ausgerollte Edge-Gateways
- Over-the-Air-Software-Updates für den gesamten Bestand

Hier starten
Bringen Sie uns Ihren wichtigsten Anwendungsfall
Das System läuft heute im Produktivbetrieb. Gebaut mit dem Team von Gilgen, im Besitz von Gilgen und von uns betrieben.